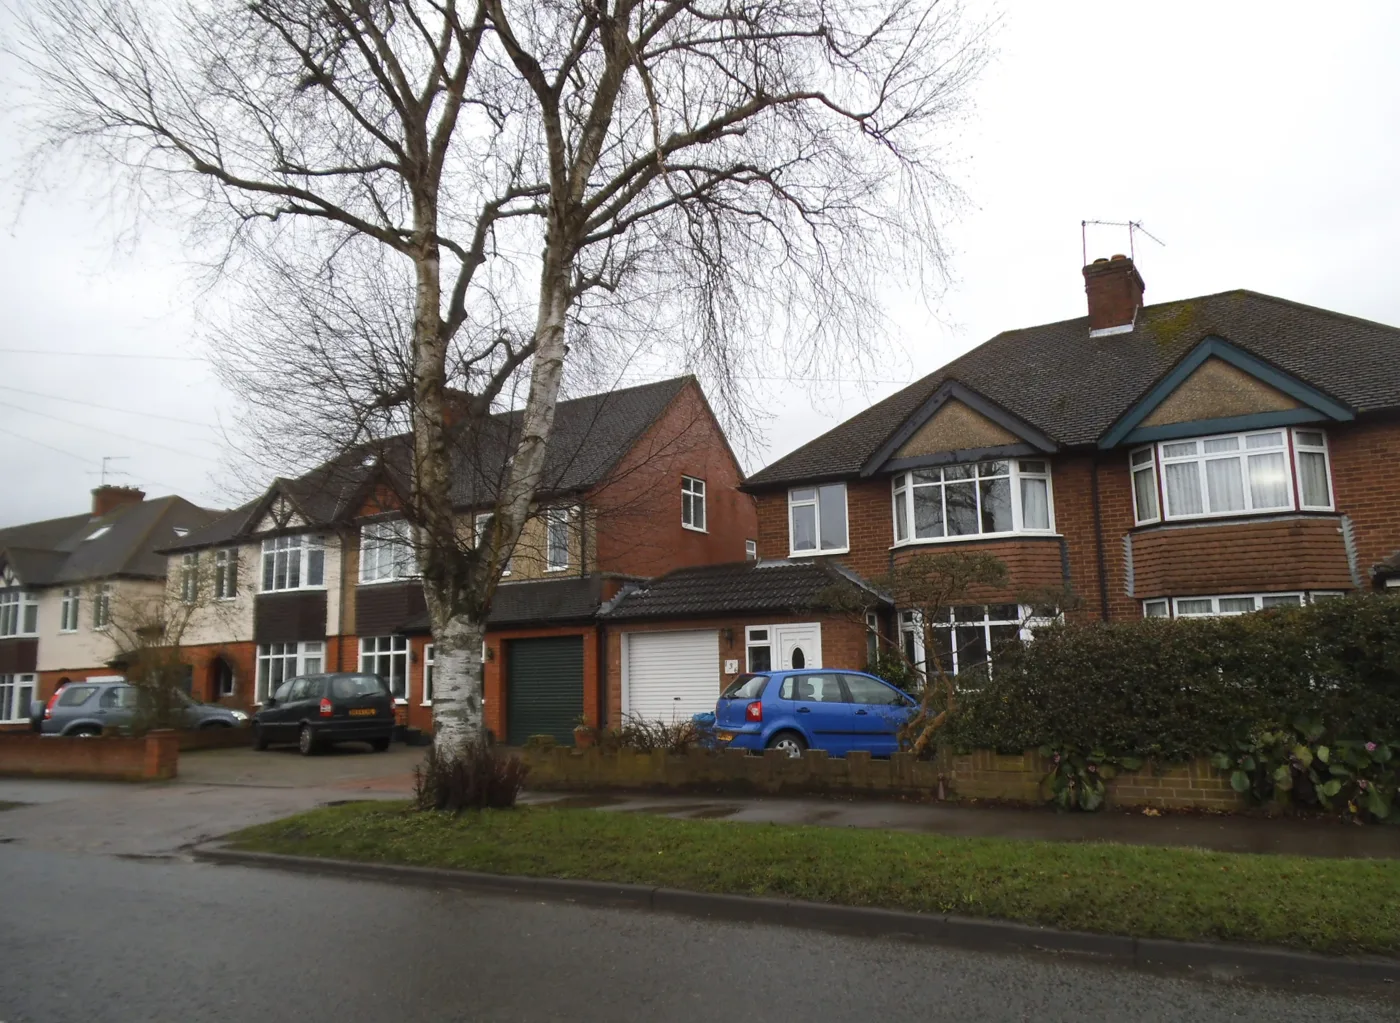

The district average has passed its December 2024 peak for the first time, up 4.3% in a year. Terraced homes rose fastest at 5.4%, and May was revised upwards.
The average St Albans home is now worth more than at any point on record. Land Registry figures for June 2026 put the district average at £651,448, up 1.8% in the month and 4.3% over the year.
That beats the previous high of £643,627, set in December 2024. It is the highest figure in a series that runs back to January 1995.
Two things to hold on to before that number goes anywhere. It is a mean average, not a median, so a handful of very large sales pull it upward. And it is in cash, not adjusted for inflation, so “a record” means a record in pounds rather than in what those pounds buy.
Six months ago the market was falling
The more interesting story is the speed of the turn. In December 2025 the St Albans average was falling at 3.7% a year. Every month since has been less bad, then better, and the district is now rising faster than Hertfordshire as a whole.
In cash terms the district average has gained £31,457 since December, and £27,114 over the twelve months from June 2025.
Terraced homes are pulling hardest
Every property type rose over the year, and the cheapest end rose fastest.
| Type | Average price | Change on the year | Change on the month |
|---|---|---|---|
| Detached | £1,255,059 | +3.6% | +2.0% |
| Semi-detached | £771,814 | +4.8% | +1.6% |
| Terraced | £579,924 | +5.4% | +1.7% |
| Flat or maisonette | £332,768 | +3.5% | +1.9% |
The detached average has now passed £1.25 million. A St Albans detached home costs more than four times an average English home of any type.
For anyone buying a first home, the index puts the first-time buyer average at £480,293, up 4.6% over the year. Someone selling one home to buy another is looking at an average of £804,207.
St Albans against its neighbours
St Albans remains the most expensive district in Hertfordshire, and by a distance. It is not, however, the fastest riser: North Hertfordshire and Welwyn Hatfield both grew more over the year, from much lower bases. Three Rivers is the county’s only faller.
| Area | Average price | Annual change |
|---|---|---|
| St Albans | £651,448 | +4.3% |
| Three Rivers | £580,120 | -1.2% |
| Hertsmere | £560,436 | +2.6% |
| East Hertfordshire | £460,778 | +4.0% |
| Dacorum | £459,438 | +1.8% |
| Welwyn Hatfield | £450,696 | +5.8% |
| North Hertfordshire | £422,616 | +7.8% |
| Broxbourne | £406,678 | +0.4% |
| Watford | £396,385 | +2.8% |
| Stevenage | £323,429 | +4.7% |
| Hertfordshire | £470,873 | +3.5% |
| East of England | £338,707 | +1.1% |
| England | £293,262 | +1.8% |
The gap that matters most is the last line. The St Albans average is 2.2 times the English average, and £180,575 above the county figure.
The May number moved, and that is normal
When the Land Registry published May, it gave the St Albans average as £638,489 and the annual change as 3.0%. In this release May has been revised to £639,766 and 3.3%.
That is not an error. UK HPI figures are built from completed sales as they are registered, so the most recent months are estimates and get restated as more sales land. June’s £651,448 is a first estimate and will move too. Early figures have been known to change sign on revision, so treat this month’s record as the best current reading rather than a settled fact.
What it means for you
If you are selling. The index is the strongest it has been for the district, and the gain is broad rather than concentrated in one type of home. Do not read the detached figure as a valuation of your house: the mean is dragged up by the very largest sales, and what you get depends on your street, not the district.
If you are buying. A 10% deposit on the district average is now £65,145. On the first-time buyer average it is £48,029. Both are higher than they were in December without wages having moved anything like as far.
If you want a figure for your own street. The index is a modelled average for the whole district. Actual completed sale prices by ward, postcode and street are on St Albans house prices, which uses Land Registry Price Paid records rather than the index.
If you are watching supply. What gets permission now shapes the next few years of this, and the district’s largest sites are tracked on St Albans planning news.
Sources
- HM Land Registry UK House Price Index, St Albans, June 2026 for the district average, the annual and monthly changes, the breakdown by property type and the first-time buyer average.
- HM Land Registry UK House Price Index, St Albans, May 2026 for the revised May figure.
- HM Land Registry UK House Price Index monthly series for St Albans, January 1995 to June 2026, for the previous record of £643,627 in December 2024 and the month by month annual changes.
- UK House Price Index June 2026 records for Hertfordshire, Three Rivers, Hertsmere, East Hertfordshire, Dacorum, Welwyn Hatfield, North Hertfordshire, Broxbourne, Watford, Stevenage, the East of England and England for the comparison table.
Update, 18 September 2026: HM Land Registry has revised the June 2026 figures since this article was published. The district average for June now reads £647,124 rather than the £651,448 reported here, and the annual change reads 3.7% rather than 4.3%. June is still a record, because the revised figure is above the previous peak of £643,627 set in December 2024, but the peak was lower than the first release showed. The July 2026 figures are in St Albans house prices fall £343 in July.
Have your say