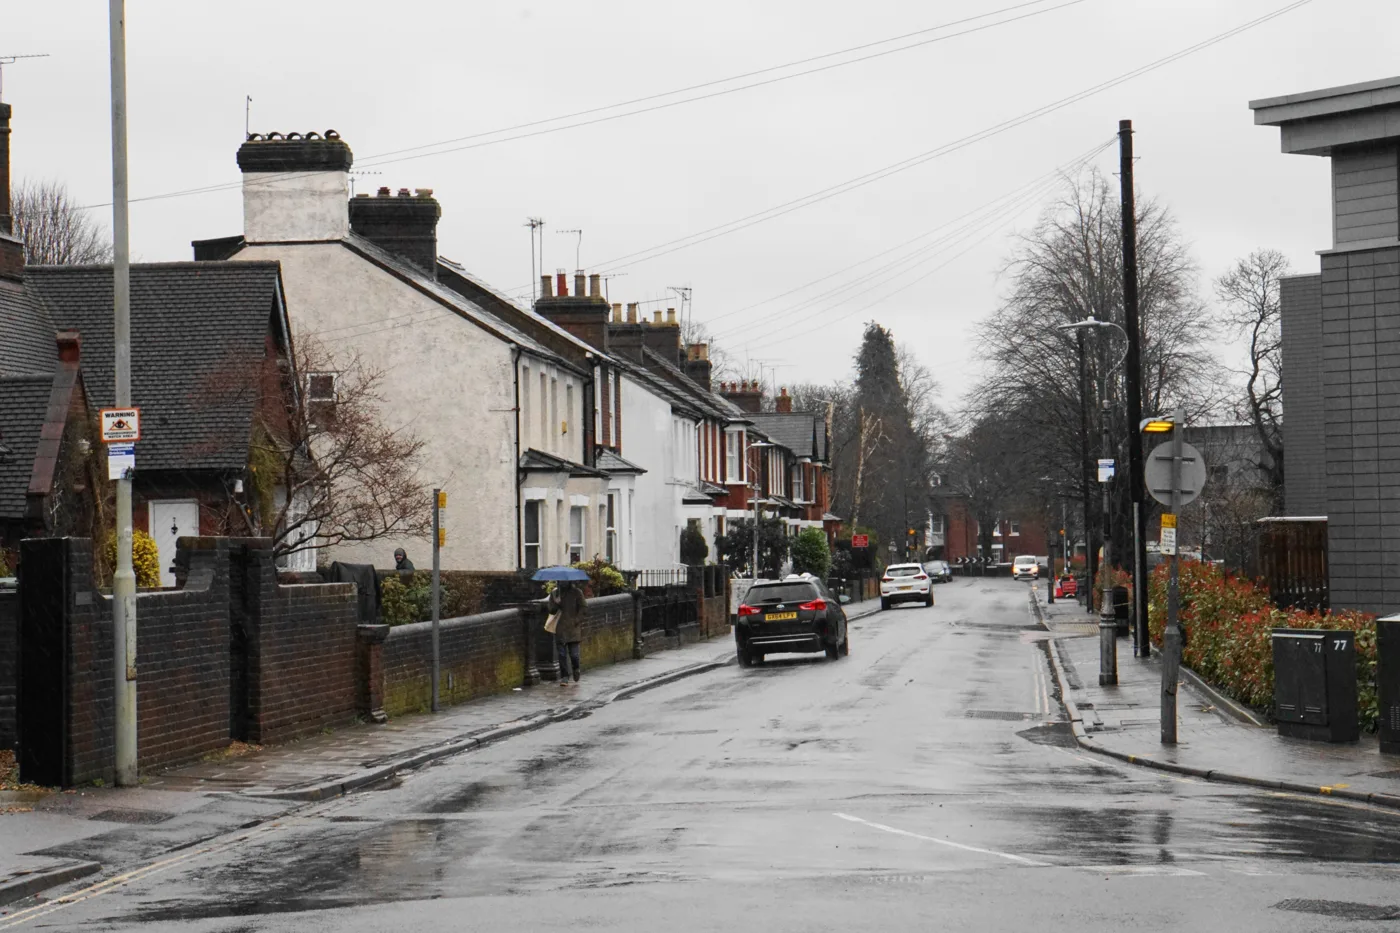

The middle St Albans home sold for £605,000 in the year to June, more than any other Hertfordshire district. Figures by ward, postcode, property type and street.
St Albans is the most expensive place to buy a home in Hertfordshire, and it is not close. The district average was £651,448 in June 2026, up 4.3% over the year, against £580,120 in Three Rivers, £560,436 in Hertsmere and £470,873 across Hertfordshire as a whole. England’s average was £293,262. A St Albans home costs more than twice the English average, and June was the highest figure the index has ever recorded here.
Two official numbers are used on this page and they answer different questions. The £651,448 comes from the UK House Price Index, a mix-adjusted monthly model of the whole housing stock, and it is the right figure for direction of travel. The £605,000 below is the median of every completed residential sale HM Land Registry recorded inside the district over the twelve months to 30 June 2026, and it is the right figure for what things actually change hands at. On that basis 1,614 homes sold in the district over the year. The index sits above the median here, which is the opposite of most places, because the district’s housing stock is weighted towards large houses while flats made up almost a quarter of what actually sold.
Harpenden is a different market to St Albans
The postcodes give the game away before the wards do. AL5, which is Harpenden, sold at a median £268,650 above AL1, the St Albans city centre postcode, over the same twelve months.
| Postcode | Covers | Median sale | Sales |
|---|---|---|---|
| AL5 | Harpenden | £793,650 | 349 |
| AL3 | St Albans west, Redbourn | £652,500 | 248 |
| AL4 | St Albans east, Wheathampstead | £617,250 | 278 |
| AL2 | Park Street, Bricket Wood, London Colney, Chiswell Green | £532,500 | 270 |
| AL1 | St Albans city centre and south | £525,000 | 469 |
None of the AL postcodes stops at the district boundary. Of the 1,727 residential sales recorded across AL1 to AL5 over the year, 1,614 were inside St Albans district, 66 fell into Dacorum at a median of £452,500, five into North Hertfordshire, four into Welwyn Hatfield and one into Hertsmere. Every figure on this page counts only the St Albans ones.
What each part of the district paid
Three things stand out in that ordering. Harpenden takes four of the top seven places and none of the bottom nine, which is why a Harpenden train season costs £424 a year more than a St Albans one and people pay it anyway. Marshalswick West tops the district at £860,000 while Marshalswick East and Jersey Farm, the ward immediately next to it, sits at £462,750, a gap of nearly £400,000 across one boundary. And St Peters, the ward that contains the city centre, the market and the Civic Centre, is the second cheapest in the whole district at £438,000, on the largest number of sales of any ward, because what sells there is flats.
St Albans by property type
| Property type | Median | Sales |
|---|---|---|
| Detached | £950,000 | 353 |
| Semi-detached | £725,000 | 416 |
| Terraced | £565,000 | 446 |
| Flat or maisonette | £328,000 | 399 |
A semi-detached house in St Albans costs £725,000. On the House Price Index, which lets you compare like with like across councils, the St Albans semi-detached average of £771,814 is higher than the detached average in Stevenage (£661,108). The £439,046 gap between a St Albans semi and a St Albans flat is the reason first-time buyers here mostly buy flats: the index has a local first-time buyer paying £480,293 in June 2026 while someone selling one home to buy another paid £804,207. That step of £323,914 is what people mean when they say the ladder is broken locally.
On the index, which measures the whole stock rather than what sold, prices rose across every property type in the year to June 2026: terraced up 5.4%, semi-detached 4.8%, detached 3.6% and flats 3.5%. Nothing in St Albans fell.
Which way the market is going
| Area | Average price | Change over 12 months |
|---|---|---|
| St Albans | £651,448 | +4.3% |
| Three Rivers | £580,120 | −1.2% |
| Hertsmere | £560,436 | +2.6% |
| Hertfordshire | £470,873 | +3.5% |
| East Hertfordshire | £460,778 | +4.0% |
| Dacorum | £459,438 | +1.8% |
| Welwyn Hatfield | £450,696 | +5.8% |
| North Hertfordshire | £422,616 | +7.8% |
| Broxbourne | £406,678 | +0.4% |
| Watford | £396,385 | +2.8% |
| East of England | £338,707 | +1.1% |
| Stevenage | £323,429 | +4.7% |
| England | £293,262 | +1.8% |
St Albans is top of that table on price and mid-table on growth. With 2023 set at 100, the district index reads 102.6, against 102.2 for England, so the recovery here has tracked the country rather than outrunning it. The month of May on its own was up 1.3%. Dacorum next door is flat over the year and Three Rivers is down 1.2%, which makes St Albans the strongest of the three western Hertfordshire districts.
Streets, where there were enough sales to say
A street median from six or seven sales is a rough guide, not a valuation. These are the district streets with at least six completed sales in the twelve months.
| Street | Median sale | Sales |
|---|---|---|
| The Uplands | £1,787,500 | 6 |
| Crabtree Lane | £1,395,000 | 7 |
| Park Street Lane | £933,500 | 8 |
| King Harry Lane | £805,000 | 6 |
| Watford Road | £802,500 | 9 |
| Vickers Mews | £785,000 | 9 |
| Boundary Road | £664,000 | 6 |
| Luton Road | £650,000 | 11 |
| Culver Road | £632,500 | 8 |
| The Ridgeway | £620,000 | 10 |
| Bernard Street | £611,000 | 9 |
| Lybury Lane | £605,000 | 7 |
| Cambridge Road | £590,750 | 6 |
| Lower Luton Road | £570,000 | 11 |
| Beningfield Drive | £500,000 | 13 |
| Campfield Road | £495,000 | 9 |
| London Road | £452,500 | 10 |
| Holywell Hill | £430,000 | 10 |
| Milton Road | £410,000 | 11 |
| High Street | £400,000 | 19 |
| Charrington Place | £357,500 | 16 |
| Hatfield Road | £326,500 | 14 |
| Camp Road | £303,750 | 16 |
| Southdown Road | £265,000 | 7 |
| Broadlake Close | £205,000 | 7 |
| Davis Court | £195,000 | 6 |
| Roundwood Lane | £151,250 | 8 |
Read the bottom of that table carefully, because those are not house prices. Davis Court sold six flats and nothing else. Broadlake Close sold six flats at a median of £201,500 and one terraced house at £510,000. Roundwood Lane is the sharpest example of all: five flats at a median of £145,000 and three detached houses at a median of £1,300,000 on the same street, which is how a street median of £151,250 ends up meaning almost nothing on its own.
High Street was the busiest address in the district, with 19 sales at a median of £400,000, and it is mixed too: eight terraced houses at £462,500, six flats at £270,000, four semis and one detached.
At the top of the year’s record, the dearest sale in the district was £4,700,000 for a detached house on Park Avenue North in Harpenden West, followed by £4,350,000 for a property on Holywell Hill in the Verulam ward, £4,100,000 on Redbourn Lane and £4,000,000 on Park Avenue South. The cheapest sales were flats at £116,000 on College Road and £123,000 on Cambridge Road, both in the Clarence ward.
You can check any individual address free on the HM Land Registry price paid search.
What this means if you are buying or selling
If you are buying and price is the constraint, the three cheapest wards are London Colney (£420,000), St Peters (£438,000) and Cunningham (£460,000). All three sell a high share of flats, and London Colney is the only one of them that is not in St Albans itself.
If you want a house rather than a flat, the semi-detached median is £725,000 and the detached median £950,000. Budget for the difference between the ward you want and the ward you can afford: Marshalswick West and Marshalswick East are next to each other and £397,250 apart.
If you are selling, you are selling into the strongest of the three western Hertfordshire districts: up 3.0% over the year and up 1.3% in the month, while Dacorum was flat and Three Rivers fell.
Whatever you do, look at what is coming. The emerging Local Plan proposes 15,045 homes across the district by 2041, with twelve strategic sites including 1,168 homes at North St Albans, 738 at North East Harpenden and 594 at West Redbourn. Details are on St Albans planning news.
Frequently asked questions
What is the average house price in St Albans?
The middle completed sale inside the district was £605,000 over the twelve months to 30 June 2026, from 1,614 recorded sales (HM Land Registry Price Paid). The modelled district average on the UK House Price Index was £651,448 in June 2026, the highest the index has recorded for the district.
Are St Albans house prices going up or down?
Up. Prices rose 4.3% in the year to June 2026 and 1.8% in the month alone. Every property type gained: terraced 5.4%, semi-detached 4.8%, detached 3.6% and flats 3.5%. Six months earlier the index had the district falling at 3.7% a year.
Is St Albans the most expensive part of Hertfordshire?
Yes, on the House Price Index. St Albans averaged £651,448 in June 2026 against £580,120 in Three Rivers, £560,436 in Hertsmere and £470,873 for Hertfordshire as a whole.
Where is the cheapest place to buy in St Albans district?
London Colney, at a median of £420,000 from 91 sales, then St Peters at £438,000 and Cunningham at £460,000. All three sell a high proportion of flats.
Where is the most expensive part of St Albans district?
Marshalswick West, at a median of £860,000 from 37 sales, then Harpenden North and Rural at £855,000 and Harpenden South at £820,000. By postcode, AL5 (Harpenden) leads at £793,650.
How much is a flat in St Albans?
The median flat or maisonette sold for £328,000 over the twelve months, from 399 sales. On the House Price Index the district flat average was £332,768 in June 2026, up 3.5% over the year.
Is an AL postcode always in St Albans district?
No. Of the 1,727 residential sales recorded across AL1 to AL5 over the year, 1,614 were in St Albans district and 66 in Dacorum, at a median of £452,500, with a handful in North Hertfordshire, Welwyn Hatfield and Hertsmere.
Sources
- UK House Price Index, St Albans (ONS / HM Land Registry) for the district average, property-type and buyer-type figures and the annual and monthly changes.
- Land Registry UK HPI open data, St Albans, June 2026 and the matching records for Hertfordshire, Three Rivers, Hertsmere, Dacorum, Welwyn Hatfield, East Hertfordshire, North Hertfordshire, Broxbourne, Watford, Stevenage, the East of England and England for the comparison table.
- HM Land Registry Price Paid linked data for the ward, postcode, property-type and street medians, being every completed residential sale recorded in the AL1 to AL5 postcode districts between 1 July 2025 and 30 June 2026, with each postcode matched to its council area and ward through the postcodes.io lookup so that only St Albans district sales are counted.
- HM Land Registry price paid search to check any individual address.
Land Registry figures are provisional and are revised as more sales complete, and the index runs two to three months behind. Confirm the latest numbers against the linked sources before making a decision. What is being built near you is on St Albans planning news; what the commute costs is on St Albans trains to London.
Have your say