
The district average rose 0.7% in August to a record £655,974, up £20,539 on a year. July's reported fall has been revised away: it was a rise.
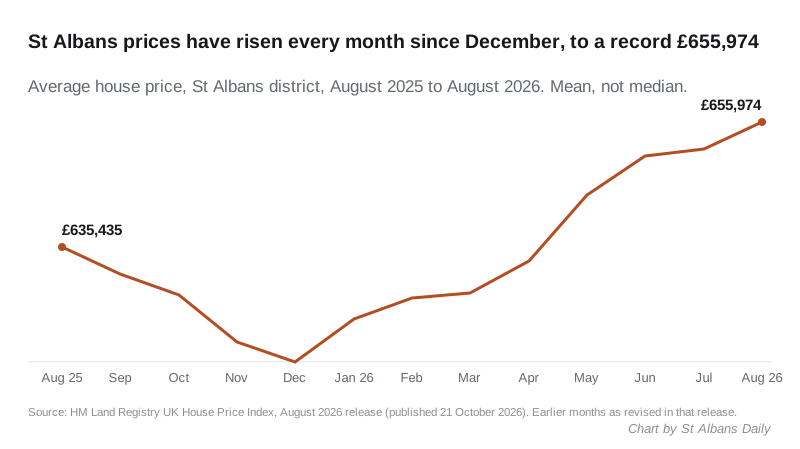
The average home in St Albans district cost £655,974 in August, a new record. That is up £4,464, or 0.7%, on July, according to Land Registry figures published on 21 October.
Over the year the average is up £20,539, or 3.2%. That is the fastest rise of any district in Hertfordshire this month.
The run behind it is now eight months long. Prices have risen in every month since December 2025, when the average stood at £616,684. Since then it has gained £39,290.
As always with this index, two caveats. The UK House Price Index average is a mean, not a median, so a few very large sales pull it upward. And it is in cash, not adjusted for inflation.
July did not fall after all
Last month we reported that prices fell £343 in July, to £646,781. That was the figure the Land Registry published at the time. The August release has revised it, and July now reads £651,510. That is a rise of 0.2% on June, not a fall.
June moved up as well. It now reads £650,429, against £647,124 a month ago. So June, July and August each set a new high for the district, in a series that runs back to January 1995. The previous peak before this summer was £643,627, in December 2024.
Revisions like this are normal for UKHPI. The most recent months rest on the fewest registered sales, so they move the most. Our July story now carries a correction note.
Every type of home is now up on the year
Last month flats were the only type cheaper than a year earlier. The revised figures change that. July’s flat average now shows a 0.4% rise, and in August every type of home is up on August 2025.
| Type | August 2025 | August 2026 | Annual change |
|---|---|---|---|
| Detached | £1,217,753 | £1,274,817 | +4.7% |
| Semi-detached | £749,707 | £780,991 | +4.2% |
| Terraced | £562,814 | £585,030 | +3.9% |
| Flat or maisonette | £329,671 | £330,508 | +0.3% |
The bigger the house, the faster it is rising. Detached homes gained £57,064 in a year. Flats gained £837. The average detached house in the district now costs almost four times the average flat.
The first-time buyer average is £481,627, up 2.5% on a year earlier.
Most expensive in Hertfordshire, and now the fastest rising
St Albans has been the county’s most expensive district for years. In August it also had the fastest annual rise, just ahead of North Hertfordshire. Two districts, Watford and Stevenage, are cheaper than a year ago.
| District | Average price | Annual change |
|---|---|---|
| St Albans | £655,974 | +3.2% |
| Three Rivers | £590,232 | +0.9% |
| Hertsmere | £553,008 | +1.5% |
| East Hertfordshire | £455,973 | +1.9% |
| Dacorum | £450,935 | +0.1% |
| Welwyn Hatfield | £446,043 | +0.7% |
| North Hertfordshire | £422,835 | +3.1% |
| Broxbourne | £414,692 | +2.3% |
| Watford | £408,659 | -0.4% |
| Stevenage | £309,123 | -2.1% |
Hertfordshire as a whole averages £469,651, up 1.4%. The East of England is up 0.2% and England 0.4%. The England average of £293,525 is less than half the St Albans figure.
What it means for you
If you are selling, the first release of any month is a draft. July was reported as a fall and is now a rise of £1,081 on the month. A valuation that leans on the newest figure is leaning on the number most likely to move.
If you are buying a house rather than a flat, the gap is widening. Detached, semi-detached and terraced homes are up by between 3.9% and 4.7% on the year. Flats are flat, up 0.3%.
If you are a first-time buyer, the stamp duty limit is getting close. GOV.UK sets first-time buyer relief in England at “no SDLT up to £300,000” and “5% SDLT on the portion from £300,001 to £500,000”. It adds: “If the price is over £500,000, you cannot claim the relief.” The local first-time buyer average of £481,627 is now £18,373 below that limit. In the July figures we reported last month, the gap was about £25,000. At the average, relief still leaves a bill of about £9,080. The rates are on GOV.UK.
UKHPI is built from completed sales registered with HM Land Registry, so it lags the market by a couple of months.
Our St Albans house prices page tracks the series month by month, and St Albans planning news covers what is being built in the district.
Sources
- HM Land Registry UK House Price Index, St Albans, August 2026 release, for the district average, the monthly and annual changes, the revised June and July figures, the breakdown by property type, the first-time buyer average and the monthly series in the chart.
- HM Land Registry: UK House Price Index for August 2026, published 21 October 2026, for the release date.
- HM Land Registry UK House Price Index for Hertfordshire and for each of the ten districts, August 2026 release, for the county table and the England and East of England comparisons.
- GOV.UK: Stamp Duty Land Tax residential property rates, read 23 October 2026, for the first-time buyer relief thresholds.
- Our own St Albans house prices report for July 2026, published 18 September 2026, for the £646,781 July figure that has since been revised.
Have your say