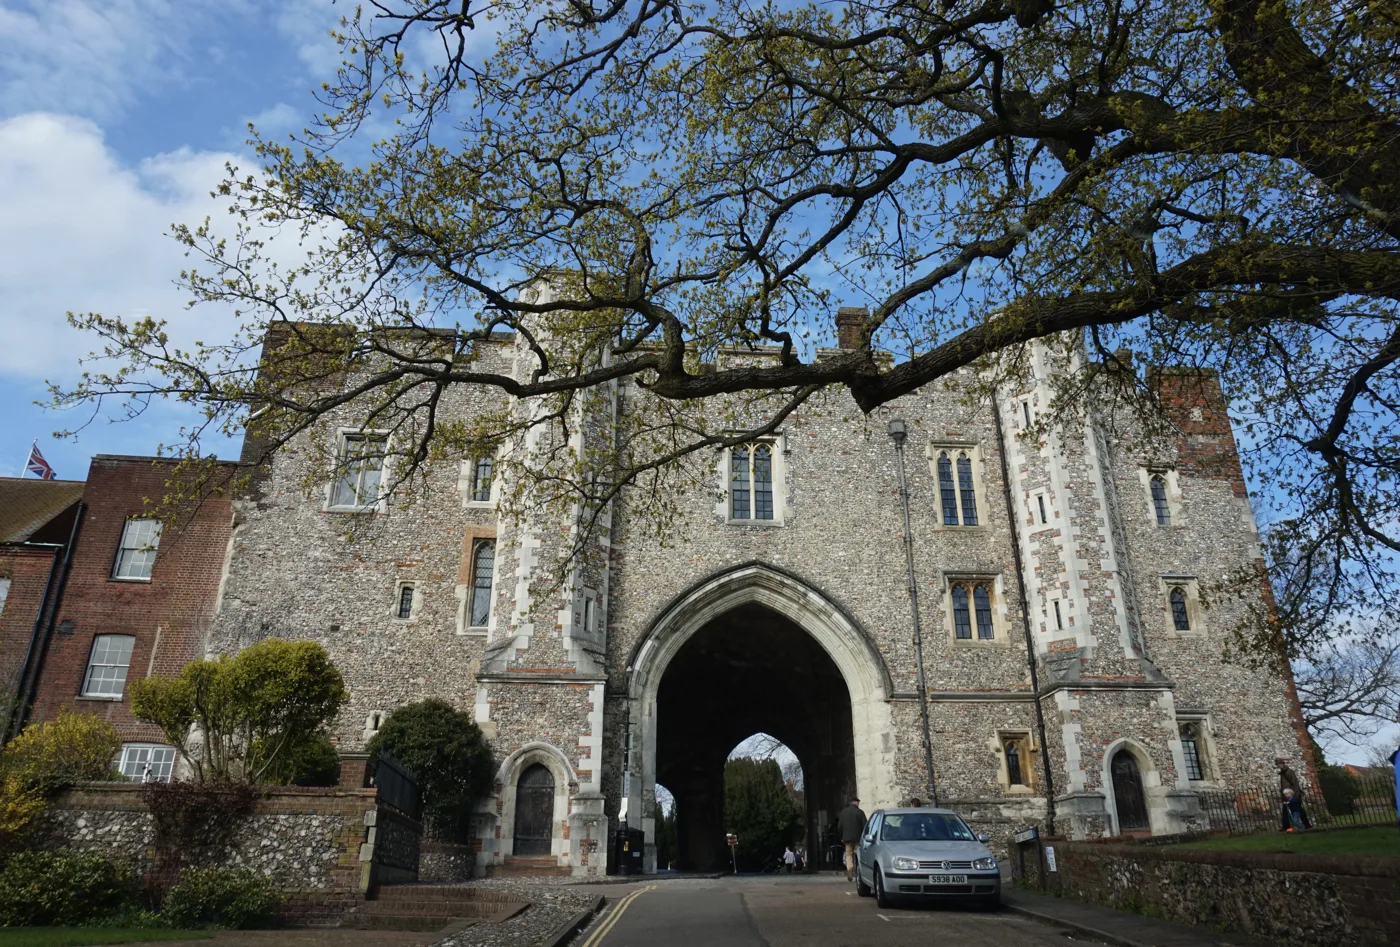

STAHS reports 75% of grades at A or A*, St Albans School 62.9%, against 48.6% at independent schools nationally. Plus the 20 August remark deadline.
A-level results landed on Thursday 13 August, and in a district that trades on its schools, only two of them have put a 2026 figure on their own website. Both charge fees. A third, in Harpenden, announced its first ever sixth-form results without a single percentage attached.
That is not a criticism of the results. It is a warning about what you can and cannot compare this week. Several St Albans and Harpenden state schools gave numbers to local papers while publishing nothing themselves, and a figure that exists only inside somebody else’s article cannot be checked against the national one. Below is what the schools have put on the record in their own words, set against the only benchmark that makes the comparison fair.
The national picture first
Across England, 28.3% of A-level results were graded A or A*, barely moved from 28.2% last year, out of 835,950 results awarded to 320,505 students. 78.1% were at C or above. In the East of England, the region St Albans sits in, the figures were 27.9% at A or above and 77.9% at C or above. Ofqual also records that 7,245 18-year-olds got an A* in every subject they took.
The number that actually matters for the two schools below is the centre-type one. Ofqual’s table 9 splits results by the kind of school or college a student sat them in: independent and private schools recorded 48.6% of results at A or above and 89.4% at C or above, against 25.4% and 76.8% across all state-funded centres. Setting a fee-charging school against the all-England 28.3% flatters it; setting it against 48.6% does not.
St Albans High School for Girls: 75% at A or A*
STAHS, the independent girls’ school on Townsend Avenue, published the fullest breakdown in the district. It reports that 37% of results were graded A*, 75% at A* or A, 94% at A* to B and 99% at A* to C, with 55% of the year group achieving nothing below an A, a fifth of the cohort taking three A* grades, and over 15% of students securing Oxbridge places.
Its own three-year table shows this is a rise rather than a plateau: A* has gone 29.5%, 36%, 37% since 2024, and A* to B has gone 87.8%, 92%, 94%.
The school also does something unusual and worth flagging, because it explains why you will not find STAHS in a league table. It says it deliberately does not submit its outcomes for league table publication, does not formally report them to news outlets, and instead publishes a full breakdown on its own site each year. On a week when most schools brief the papers and post nothing, that is the reverse of the local norm.
St Albans School: 62.9%, but read the small print
St Albans School, the independent school by the Abbey Gateway, reports 525 entries, a 100% pass rate, 90.1% of grades at A*, A or B, 62.9% at A* or A and 25.3% at A*, worth 49 UCAS points per entry and 154 per candidate. Ten candidates achieved at least four A* grades, twenty gained at least three, ten took straight A* grades, and 56 candidates achieved nothing less than an A.
The small print is the school’s own heading: the table is labelled A level with Extended Project, so the EPQ is folded into those 525 entries. Ofqual’s national tables count A levels only. The 62.9% is therefore not quite like for like with the 48.6% independent-sector figure, and the gap is real but slightly softer than the raw comparison suggests.
Headmaster Joe Silvester said results day “is about far more than grades”, and that leavers were heading to Oxford and Cambridge and on to medicine, engineering, the arts and the humanities.
Katherine Warington: a first cohort, and no numbers
Katherine Warington School on Lower Luton Road opened on 2 September 2019 and this was its first ever set of sixth-form results. The school says the vast majority of students got their first-choice university, that one student took four A* grades and a place to read general engineering at Durham, that another is going to Oxford to read philosophy, politics and economics, and that others have taken degree apprenticeships with Raytheon and Visa.
No percentage appears anywhere in the announcement, so there is nothing to compare. For a school putting a Year 13 cohort through for the first time, that is understandable: with one year of data there is no trend to report and a small cohort makes any share volatile. It is still worth saying plainly rather than implying a figure exists.
Why nobody can rank St Albans schools this week
Three separate problems stack up.
Schools count different things. A school quoting A*-B has no national equivalent to be measured against, because Ofqual publishes A-and-above and C-and-above only. A school quoting “including equivalents” or “UCAS equivalents” has folded BTECs and Extended Projects in. A school quoting the share of students hitting a grade combination is measuring something else entirely from a share of grades.
The district map is not what people think it is. Ofqual publishes A-level outcomes by local authority district, and rival coverage tends to quote a district ranking off it. The regulator’s own note says all grades and students are assigned to areas using the postcode recorded for the exam centre in the National Centre Number register, and that the accuracy of the map depends on the accuracy of those records. In a district holding two large independent schools whose intake reaches well beyond the district boundary, a high St Albans ranking is partly other people’s children. It describes results sat here, not the achievement of children who live here.
Selection and fees do most of the work. The 23-point gap between independent centres (48.6%) and state-funded ones (25.4%) is bigger than the difference between any two years of national results this decade. Grammar schools sit at 43.4%, further education establishments at 12.8%. Compare like with like or the exercise is meaningless.
The schools that published nothing
Checked on their own websites on 14 August, the district’s other sixth forms had no 2026 figures up. Sandringham School posted a congratulations message to its Year 13 class with a results-day video and no numbers; its results page still carries the 2025 table, which showed 43% at A*-A and 73% at A*-B. St Albans Girls’ School still shows its 2025 summary, Verulam School its 2025 average point scores, Beaumont School a news list whose most recent item is “Record Exam Results for 2025” from last August, and The Marlborough Science Academy, Roundwood Park, Townsend CofE, Nicholas Breakspear and Loreto College the same. St George’s School in Harpenden has published nothing since 20 July.
Most of these are strong schools having a good week, and several briefed the local press with numbers. The point is narrower: until a figure is on the school’s own site, it cannot be verified, and we will not repeat one we cannot check. We will update this page as they go up.
What it means for you
If a grade looks wrong, the clock is already running, and the deadlines are not the ones most families assume.
- Priority review of marking: 20 August. This is the fast one, for A level, T Level and Level 3 vocational results only, and it exists for students whose university place depends on the outcome. Exam boards must complete it within 15 calendar days.
- Standard review of marking: 24 September, completed within 20 calendar days.
- Clerical re-check: 24 September, completed within 10 calendar days. This only confirms the marks were added up and recorded correctly. It does not re-mark anything.
- Access to scripts: 24 September for teaching and learning purposes.
Two things families get wrong every year, both stated by JCQ. The request goes through the school or college’s exams officer, not direct from a student to the exam board, unless the student was a private candidate. And there is no grade protection: marks and subject grades can go down as well as up, which is why written consent is required before a review is submitted.
If a university place fell through, Clearing is open now and does not close until October, though the courses with capacity thin out fast in the first week.
GCSE results follow on Thursday 20 August, and the same review deadline of 24 September applies to them.
Anyone weighing a move into the district on the back of this week should read the school figures alongside what it costs to live in the catchment: our St Albans house prices page has the district median, the split by postcode and the ward-level detail.
Have your say